Authors:
(1) Martyna Wiącek, Institute of Computer Science, Polish Academy of Sciences;
(2) Piotr Rybak, Institute of Computer Science, Polish Academy of Sciences;
(3) Łukasz Pszenny, Institute of Computer Science, Polish Academy of Sciences;
(4) Alina Wróblewska, Institute of Computer Science, Polish Academy of Sciences.
Editor's note: This is Part 9 of 10 of a study on improving the evaluation and comparison of tools used in natural language preprocessing. Read the rest below.
Table of Links
Abstract and 1. Introduction and related works
- NLPre benchmarking
2.2. Online benchmarking system
- NLPre-PL benchmark
- Evaluation
- Conclusions
- Appendices
- Acknowledgements
- Bibliographical References
- Language Resource References
4.3. Results
Impact of system architecture We assess the quality of the selected NLPre systems contingent on the NLPre-PL benchmark. In Polish (and most other languages), non-neural NLPre tools are currently not widely developed. We evaluate two of them: Concraft and UDPipe. Although they do not use neural network algorithms to train models, their quality does not significantly differ from the best tested neural systems, especially in terms of segmentation, which UDPipe performs best (Words) or second-best (Sentences) (see Tables 2 and 3). We cannot unequivocally say that the system architecture has a decisive influence on the results, as spaCy models, even transformer-based, output the lowest quality.
Impact of tagset selection We compare systems trained and tested on data adjusted to two tagsets – the Morfeusz tagset (see Table 2) and the UD tagset (see Table 3). The average scores indicate that only COMBO performs better on Morfeusz-annotated data than on UD data. The performance of Trankit, UDPipe, and Stanza slightly decreases on Morfeusz data. Notably, all spaCy models trained on this dataset record a significant quality drop mainly due to poorly performed morphological analysis, i.e. UFeats values (and thus also the low AllTags values, i.e., matching between UPOS, XPOS, and UFeats). Regarding segmentation, UPOS and XPOS tagging, and lemmatisation, the tagset selection does not negatively affect the results, and the systems perform comparably.
Impact of the size of training data Intuitively, the size of the training data affects the prediction quality. Considering the data size factor, we compare the average F1 scores of the NLPre systems trained on NKJP1M (see the last row in Table 4) and on PDB-UD (see Table 4), which is two orders of magnitude smaller. The results confirm our intuitive assumptions – there is a difference of 6.21 between the mean F1 scores obtained by the systems trained on the smaller PDB-UD (avg. F1 of 88.16) and those trained on the larger NKJP1M (avg. F1 of 94.37).
When comparing the performance of individual systems on the smaller PDB-UD dataset, Trankit turns out to be the undisputed winner in all tasks except lemmatisation. However, considering the average performance of all tasks, COMBO and Stanza perform the best.
In alignment with contemporary developments on zero-shot learning, we test the predictive capabilities of GPT-3.5 acquired via the prompting technique (Brown et al., 2020). Despite comprehensive instructions along with the UD tree examples in the prompt, the results are highly unsatisfactory. An error analysis has revealed that 1) the GPT model modifies the input texts (e.g. adds elided words, alters the word’s declension and conjugation, leading also to non-existent words); 2) while parsing questions, it answers them or returns information that they cannot be answered; 3) it replaces Polish words with their foreign equivalents; 4) it outputs graphs with cycles, thus not adhering to UD trees. Even for GPTs, achieving UD-compliant morphosyntactic analysis is challenging when they lack access to training examples. GPT-3.5’s results are not included in the leaderboard.
Impact of split heuristics As outlined in Section 3.1, NKJP1M has no official split into train, dev, and test subsets. Since intuitively, the type of document can affect text processing, we propose two alternative splits, i.e. byName and byType. We compare the F1 scores for these two splits to verify this hypothesis. For the byName split, the average F1 for tasks and systems is 90.69, and for the byType split, it is 90.56. The difference is negligible, indicating that the document type, and hence the text domain, does not affect the quality of the NLPre tasks. Based on this outcome, we arbitrarily choose the more balanced byType split as binding in the final NLPre-PL benchmarking system. The detailed results of all experiments are in Appendix 6.2.
Inference time In the context of benchmarking, quality is a fundamental factor. In our case, the best average F1 scores are achieved by COMBO and Stanza, far ahead of spaCy and Concraft. The second crucial issue is the processing time of the evaluated NLPre systems, especially their inference time.[20] We calculate the times in which the systems tokenise, tag and lemmatise the input text.[21] The exception is COMBO with the mandatory parsing module that cannot be disabled. Therefore, its calculations include the parsing time as well. The inference time, corresponding to the number of tokens processed per second, is provided in the last two columns of Tables 2 and 3. On CPU, the fastest systems are spaCy and UDPipe, and the slowest is Concraft. Other systems process one order of magnitude fewer tokens per second than the top ones. On GPU, spaCy is the undisputed winner, followed by Stanza, UDPipe, COMBO and Trankit.
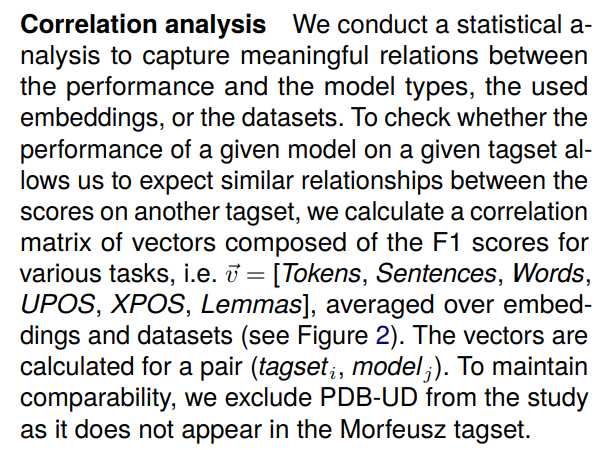
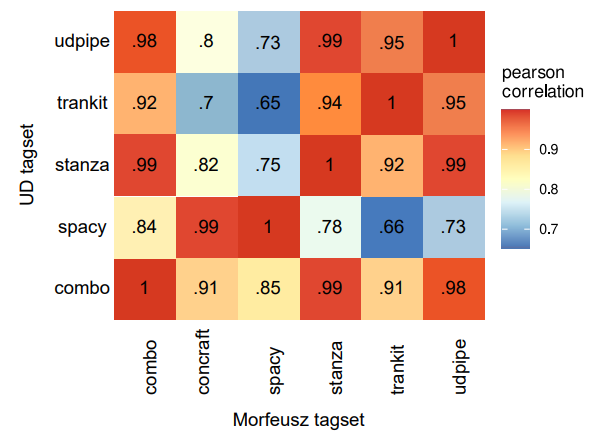
Pearson’s correlation r suggests that the results are linearly proportional for the same models and different tagsets, which we conclude from the values close to 1 at the intersection of (modeli, tagsetud) and (modeli, tagsetnkjp). Even though correlation coefficients are generally high (i.e. r ∈ [0.90, 0.99]) for most pairs (modeli, tagsetud) and (modelj, tagsetnkjp), there are noticeable lower values for spaCy, i.e. r ∈ [0.66, 0.78]. We hypothesise that this is due to the non-linear rate of changes between the scores, as all Spearman correlation coefficients exceed 0.89 (i.e. ρ > 0.89).
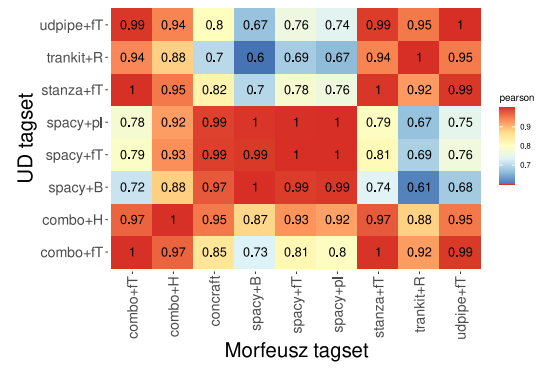
The results of a more granular analysis of Pearson’s r between vectors of F1 scores for triples (tagseti , modelj , embeddingsk), averaged over datasets, show a strong correlation for the same models, regardless of the tagset and the embedding (see Figure 3). Hence, if a change in the tagset or embedding causes an increase in one task, a proportional increase in remaining tasks is expected.
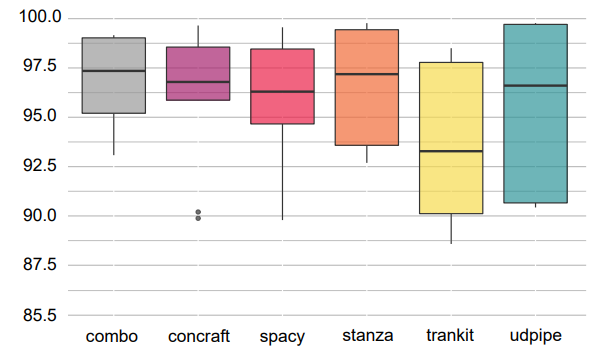
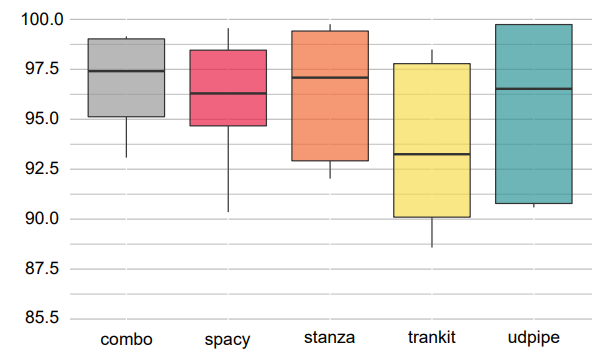
Boxplot charts (see Figures 4 and 5) determine the stability of the model results for a given tagset regardless of dataset and embedding. One box shows the scattering of F1 scores for Tokens, Sentences, Words, UPOS, XPOS, and Lemmas tasks. The shortest COMBO’s box indicates a relatively similar performance of the model across tasks for each triplet (COMBO, embeddingj , datasetk).
This paper is available on arxiv under CC BY-NC-SA 4.0 DEED license.
[20] We share a conviction favoured in the NLP community that the training time is slightly less requisite than the inference time since models are trained only once but then constantly reused for predictions. We thus provide inference times.
[21] We run tests uniformly on CPU – Intel Xeon Platinum 8268 processor (1 node with 12 cores), and GPU – 2x Tesla V100-SXM2. The machines used to train the models are listed in Appendix 6.1.

